|
STREAMLINING ORDER FULFILLMENT PROCESS FUNCTIONS FOR HIGHER PRODUCTIVITY AND FLEXIBILITY RACIONALIZAČNÉ FUNKCIE PROCESU VYBAVOVANIA OBJEDNÁVOK PRE ZVÝŠENIE PRODUKTIVITY A PRUŽNOSTI Olli-Pekka K. Hilmola
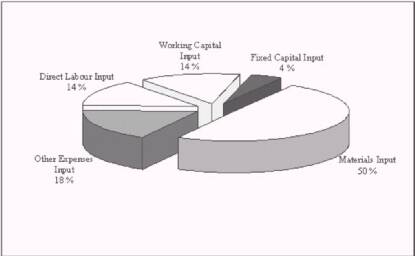
According to Vora (1992) the top and middle management uses much more frequently partial productivity measurement and focus is then in the measures of labor, material and capital. Despite of this, partial productivity measurement is often concentrated in the measurement of direct labor performance, even if the most important focus should be taken to partial productivity of knowledge-workers and materials (Drucker 1999; Hilmola 2000a; Helo, Hilmola & Maunuksela 2000; Helo, Hilmola, Maunuksela & Kekäle 2000). However, direct labor performance measurement was and still is caused by traditional cost accounting practices, which share overheads with direct labor hours to end products, production lines, distribution channels and customers. Thus, measurement of direct labor performance is not the same as total productivity. It is only representing one, often insignificant part of total productivity performance. So this traditional productivity measure could be called partial productivity of labour, if indirect labour is also included. According to Sumanth's (1979; 1998) classification the partial productivities have six different classes, in Craig and Harris (1973) model there were four. Often different partial productivities are substitutes for each other and Gold (1985) uses term ”network of productivity relationships” to highlight this issue (see Hilmola 2000b and also Takala, Sumanth, Hilmola, Helo & Generalis 2000). For example, decreasing labor costs may increase the costs of direct material, other expenses, energy and capital. So the total productivity may decrease, even if the partial productivity of labor is increasing. Other intangible competitive factors may suffer from labor productivity improvements too. Company’s order fulfillment flexibility could decrease (product mix and new product introduction), lead times could increase rapidly and quality levels might even be affected (Skinner 1986; Karmarkar 1987; Suri 1998: 153-187; Helo & Hilmola 2000). Often these intangible factors are the main characteristics among the product price, which customer(s) notice and eventually judge whole company’s performance. As Keltner, Finegold, Mason & Wagner (1999), which have studied service sector productivity, noted following: ”Reductions in labor-intensity were viewed as central to performance in some market segments but not others. In particular, in higher value-added market segments, a more labor-intensive service delivery was expected to improve not hurt performance. More labor-intensive service delivery was believed to increase customer loyalty, help to develop a customer relationships that competitors would find difficult to replicate, and therefore support premium pricing.” Often downsizing efforts are focused towards labour input. In past, especially Taylor pioneered on the area of direct labour productivity improvement. However, in current organizations labour input item is not presenting significant part from total input, sometimes its impact on total productivity improvement is least significant. Plenert (1995) has even argued that labour productivity improvements in most situations decrease total productivity. However, improvement of labour productivity is not so easy, as could be assumed in the first place. For example, low performing labour could have its origins in the policies and career development: Managers often emphasize delegate their increased tasks to the group of recruited subordinates and this may lead to devastating enlargement of labour force and other expenses (Parkinson 1964). Often organizations use non-paid overtime to improve labour productivity performance, but productivity in these circumstances does not improve at all, because the real efficiency is not improving (Kendrick 1984: 37-40). This is especially the case with salaried workers, communication equipment (mobile phone, e-mail, fax etc.) increases availability of worker without any respect to time and place. As Roach (1996) argued: ”Like it or not, that may be the ugly secret of apparent productivity-led recovery in United States: a stretched workforce is delivering more only because it's working more.” One main problem of productivity improvement of labour is the performance of individuals compared to mean. Buzacott (2000) presented results from applied psychology research field: Professionals (e.g. dentist, doctor, attorney) had most minor standard deviation compared to mean performance (5%), blue collar workers (e.g. packing, machine operator, grocery checker) had standard deviation of 20 percent, crafts (e.g. cook, repairman, claim evaluator) had standard deviation of 32 percent and least standardized job was sales of life insurance (standard deviation of 120 %). So imaginary assembly line, containing six fixed allocated tasks (statistical dependency), which all require separate operator, would yield way below average performance (when no WIP is allowed). Buzacott (2000) claims, that performance of teams, used in blue and white collar work, would not yield any better results. Their performance might be limited to the performance of worst or slowest team member, phenomenon which could be observed easily for example in the University or College classes. However, this phenomenon might be restricted to situations, when a team is completing only one particular task. But when team members are completing different operations, which are all completed separately, are statistically dependent and need special skills, are benefits from team based learning evident. Results may include following: multi-skilled workforce, less variable task times, shorter task times and setup times. For example, in this kind situations lead times are reduced dramatically, and excess capacity could appear. It is depending from organization, should it in this situation increase work load, reduce lot sizes or reduce number of workers (Suri 1998: 363-381; Hilmola & Helo 2000). Another, also usable with multi-skilled workforce, solution for labour productivity improvement is to admit that other workers are performing better than others and perfect equality could not never be reached. Best yield could be obtained with allowing little inventory buffers in the front of slower workers or to sequence more tasks to higher performing ones (Hurley & Kadipasaoglu 1998; Buzacott 2000). Value added per labour input -measure has been used widely in the practice to reveal productivity improvements of labour. Justification for this kind of behaviour could be found, for example from the research results of Mohanty and Rajput (1988). They argue, according to one steel industry case study, that total productivity is significantly correlated with both absolute amount of value added and partial productivity of material. It should be noted, that their research did not find any correlation with total productivity and partial productivity of labour. Also Harvey & Morris (1981) concluded in their empirical research of British machine tool industry, that value added per employment measure will increase its value mostly because of value added increases and labour changes will reveal only minor role. Despite the importance of value added and material productivity, the use of value added as output for partial productivity of labour has not received acceptance from researchers. According to Gold (1985) there are plenty of different external (i.e. industry sector, proportion of salaried to waged labour, interest rates) and internal (i.e. product mix, resource mix, capital investments) factors, which affect on value added with minor or any contribution of labour. Therefore this measure couldn't be used as output measure for this input item. Also the use of man-hours representing total labour input would yield misunderstandings in the situations of high inflation: increases in the salaries and wages would tend to increase productivity. Stainer (1997) shares similar opinion with Gold and assumes, that value added is not relevant measure of productivity in any circumstances, because it does not have any relationship with productive process. According to Stainer (1997) much more useful approach to manage labour productivity properly, is to decompose total productivity on three different components with respect of labour input item. In formal terms: Hypothesis: ”Order fulfillment process functions could not be flexible with regard of value added.” According to the Figure 1. direct labour input was Alfa's third important input item and it had 14 percent share from total input. As in general industrial electronics contract manufacturers have potentiality to improve their total productivity with improvement of partial productivity of labour. Also Alfa's management had this kind of opinion and it was assumed, that improvement of direct labour productivity could improve Alfa's total productivity and profitability. Rantanen (1995: 115-141) shares same kind of view, and argues that in the activity level the improvement of labour productivity has often the greatest potentiality. Despite of this, the effects to the profitability performance (e.g. ROI) in analyzed empirical case company was minor.
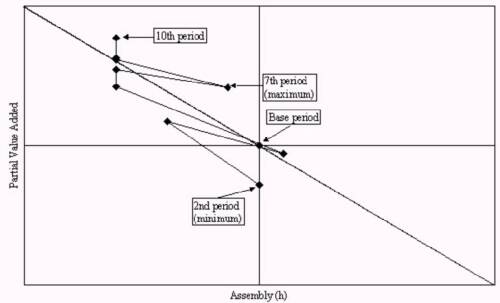
Figure 1.Total input of accounting year 1999 divided further to five different input item's according to Sumanth's classification (1979, 1998). Alfa's interest towards the labour productivity improvement is not quite unique, if it is compared to the Sumanth's (1998: 221-226) case analysis of one Indian electronics manufacturer. This manufacturer had improved its labour productivity during the five year period with over 50 percent. It should be noted, that in this same five year period all the other partial productivities and as well total productivity decreased. However, Alfa's approach to the labour productivity improvement was different as compared to this example. Aim was to combine other resources and non-financial competitive characteristics to the improvement process. The main goal was to encourage direct labour resources in the use of flexible working times (volume flexibility), decrease order fulfillment process lead-times and being able to identify in the short-term the profitability of three different functions in order fulfillment process. Hannula's (1999: 116-123) doctoral dissertation contains some support for this kind of strategy. In two of its six empirical cases significant improvements in labour productivity were reported simultaneously with most of other partial productivities. In the Alfa's case three from four mentioned functions were part of the order fulfillment process: Named as surface mount technology (SMT), through hole technology (THT) and assembly. Purchasing was the fourth one, which is supporting function in its nature, and is not analyzed further in this study. From these three remaining functions, assembly is the most important in terms of direct labour productivity: Over 80 percent from total working hours are realized in this phase. Remaining amount of work is completed almost equally in SMT and THT functions. However, these two ”minor” functions have significant impact in the aspects of competitiveness and fixed capital productivity. Within certain products SMT knowledge is the requirement to be in the markets. In the Figure 2. is presented the value added per available working time (h) in assembly function during different periods. In this particular figure as well as in the following, the value added in certain period will increase upwards in y-axis. However, amount of working time will increase in x-axis to the left. It is also important to define concept of available working time: The total direct labour hours, from which company pays for. For example according to TOC utilization ratio of 60 percent means, that this percentage amount was used from available working time to produce supplied products. In this context this 60 percent was actual working time (h). (see Plossol 1994: 204-210; Klammer 1996; Ptak & Schragenheim 1999: 159-161; Corbett 1998: 169-174; Helo 2000) It could be noted, that in general assembly function’s blue collar workers are flexible and management is able to use flexibility, when it is needed. However, during the second period performance surges, maybe because of the problems with flexibility with respect to the value added at this particular period. Causes could also be found from the efficiency and product mix. In the following periods flexibility gives its significance: Most impressive performance is achieved during the seventh period, when value added per hour is in its maximum. During this maximum performing period partial value added per available working time is 13,5 percent above base period. Almost with the same amount below was the performance minimum (the second period), when performance was 13,9 percent under base period.
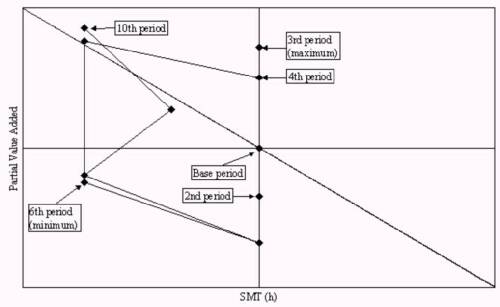
Figure 2.Alfa's partial value added per available working time in the assembly function. From the performance of SMT function (Figure 3.) could be noted, that during the first four periods available working time does not change with the respect of partial value added. During the second period partial value added is 10,5 percent below base period, but in contrast the third period's partial value added is 21,7 percent above (maximum). In both of these cases the same amount of available work is invested to gain value added. This might have its origins in the amount of protective capacity to ensure that assembly function is not starved for the items which are needed in the end-products (Corbett 1998: 169-174). Also the differences in the product routings between different product groups could have the affection: Customers had just recently introduced products, which used newer technology and different product architecture, and they demanded SMT resources quite a much. After these four periods value added per working time does not show any positive development, mainly because the available amount of working time is increasing in SMT function, and in the meantime partial value added is decreasing. During the sixth period minimum of value added per available working time is faced, when it is 24 percent below base period. As could be noted from the Figure 3., this decrease is caused mostly by the lack of efficiency in available working time component. Base period performance is reached in the tenth period, when the level of partial value added increases to the required level with the invested available working time.
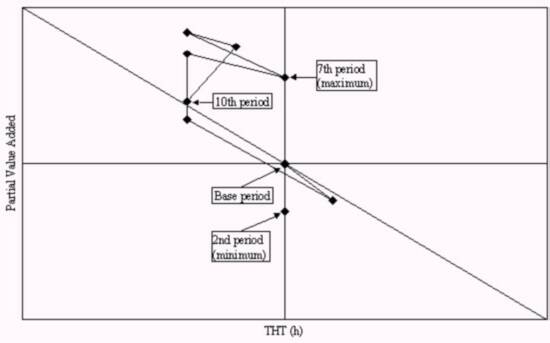
Figure 3.Alfa's partial throughput per available working time in the surface mount technology function. Partial value added per available working time in THT function shows better development than SMT function and it has similarities with assembly. However, the first three periods are showing similar development as SMT function, but with smaller value added variation. This indicates that the protective capacity to shield the assembly function performance is much smaller than in the SMT function (Corbett 1998: 169-174). The minimum was reached during the second period, when performance was 18 percent below base period. In the fourth period available working time shows flexible features and this ensures almost equal performance with base period, even when the value added was decreasing. Available working time flexibility only enhances in the following period, in terms of the value added growth. After this performance only improves and during the seventh period maximum was achieved. During this period performance was 33 percent above compared to base period. However, after these four high performing periods, performance of THT function during tenth period declined to the level of base period.
Figure 4.Alfa's partial throughput per available working time in the through hole technology function.
As was concluded in the empirical data analysis phase, functions of assembly and THT were flexible with regard of value added. However, SMT function was very inflexible with its operations. This could be explained with the variation of value added component. Standard deviation as measured with percent was in quite same levels. However, two other functions (assembly and THT), were able to change their values at the same time to the same direction. Maybe SMT function had some sort of problems with the usability of different resources. Main causes could also be found from the learning process, maybe SMT function and customer were not able to deal sufficiently with new product introduction process. According to analyzed graphs and correlation tests, were research hypothesis rejected. Different functions of order fulfillment process are able to perform their operations with-in flexible manner. This was also felt to be the one major advantage of used labour productivity measurement. Very first time ordinary blue collar worker had opportunity to know, how much his/her own function should create value added to breakeven in profits. Buzacott, John A. (2000). The impact of worker differences on production systems. Pre-prints of 11th International Working Seminar on Production Economics (Igls/Innsbruck, Austria), vol. 3, pp. 71-80. Corbett, Thomas (1998). Throughput Accounting. Great Barrington, MA: The North River Press. Craig, Charles E., & R. Clark Harris (1973). Total productivity measurement at the firm level. Sloan Management Review, 14:3, pp. 13-29. Drucker, Peter F. (1999). Knowledge-worker productivity: the biggest challenge. California Management Review, 41:2, pp. 79-94. Gold, Bela (1985). Foundations of strategic planning for productivity improvement. Interfaces, 15:3, pp. 15-30. Hannula, Mika (1999). Expedient Total Productivity Measurement. Tampere University of Technology: Acta Polytechnica Scandinavica. Harvey, R.A. & Shirley E. Morris (1981). Pathways to productivity improvement. OMEGA – International Journal of Management Science, 9:2, pp. 143-153. Helo, Petri (2000). Dynamic modelling of surge effect and capacity limitation in supply chains. International Journal of Production Research, 38:17, pp. 4521-4533. Helo, Petri & Olli-Pekka Hilmola (2000). A queue model based analysis for response improvement in PCB production. Pre-prints of 11th International Working Seminar on Production Economics (Igls/Innsbruck, Austria), vol. 1, pp. 129-136. Helo, Petri, Olli-Pekka Hilmola & Ari Maunuksela (2000). Modelling product development productivity with system dynamics. Proceedings of the 18th International Conference of the System Dynamics Society (Bergen, Norway). Helo, Petri, Olli-Pekka Hilmola, Ari Maunuksela & Tauno Kekäle (2000). Measurement of product development productivity. International Conference on Productivity and Quality Research 2000 (Jerusalem, Israel), vol. 1, pp. 173-178. Hilmola, Olli-Pekka (2000a). Improving total productivity with GT-card. In Helo, Petri & Tatjana Welzer (2000, eds.): Contemporary Applications and Research Issues in Industrial Product Modelling. University of Vaasa Publications, pp. 81-90. Hilmola, Olli-Pekka (2000b). Impact of outsourcing decisions on total productivity. Proceedings of the 5th Annual International Conference on Industrial Engineering (Hsinchu, Taiwan, R.O.C.). Hilmola, Olli-Pekka & Petri Helo (2000). Improving Product Time-To-Market - an Application of DSM and TOC. The Second MIT DSM International Workshop (Boston, USA). Hurley, Simon F. & Sukran Kadipasaoglu (1998). Wandering bottlenecks: speculating on the true causes. Production and Inventory Management Journal, 39:4, pp. 1-4. Karmarkar, Uday S. (1987). Lot sizes, lead times and in-process inventories. Management Science, 33:3, pp. 409-418. Keltner, Brent, David Finegold, Geoff Mason & Karin Wagner (1999). Market segmentation strategies and service sector productivity. California Management Review, 41:4, pp. 84-102. Kendrick, John W. (1984). Improving Company Productivity. London: The Johns Hopkins Press Ltd. Klammer, Thomas (1996, editor). Capacity Measurement & Improvement: A Managers Guide to Evaluating and Optimizing Capacity Productivity. USA: Irwin. Mohanty, R.P. & Illiyas Rajput (1988). Productivity measurement in a manufacturing company. International Journal of Operations and Production Management, 8:4, pp. 65-78. Parkinson, Northcote C. (1964). Parkinson's law. In Koontz, Harold & Cyril O'Donnell: Management — a Book of Readings, pp. 160-163. Plenert, Gerhard (1995). Productivity and quality in a developing country. In Sumanth, David J., Johnson A. Edosomwan, Robert Poupart, Carl G. Thor: Productivity & Quality Management Frontiers VIII, pp. 194-202. Plossl, George (1994). Orlicky's Material Requirements Planning. New York: McGraw-Hill. Ptak, Carol A. & Eli Schragenheim (1999). ERP: Tools, Techniques, and Applications for Integrating the Supply Chain. Boca Raton: St. Lucie Press /APICS series on resource management. Rantanen, Hannu (1995). The Effects of Productivity on Profitability. Lappeenranta University of Technology: Research Papers (dissertation). Roach, Stephen S. (1996). The hollow ring of the productivity revival. Harvard Business Review, 74:6, pp. 81-89. Skinner, Wickham (1986). The productivity paradox. Harvard Business Review, 64:4, pp. 55-59. Stainer, Alan (1997). Capital input and total productivity management. Management Decision, 35:3-4, pp. 224-232. Sumanth, David J. (1979). Productivity Measurement and Evaluation Models for Manufacturing Companies. Michigan: University Microfilms International. Sumanth, David J. (1998). Total Productivity Management. Florida: St Lucie Press. Suri, Rajan (1998). Quick Response Manufacturing. Portland: Productivity Press. Takala, Josu, David J. Sumanth, Olli-Pekka Hilmola, Petri Helo & George Generalis (2000). Productivity analysis of some electronics manufacturing service companies. International Conference on Productivity and Quality Research 2000 (Jerusalem/Israel), vol. 1, pp. 100-105. Vora, Jay A. (1992). Productivity and performance measures: who uses them? Production and Inventory Management Journal, 33:1, pp. 46-49. ABOUT THE AUTHOR / O AUTOROVI M.Sc. Olli-Pekka Hilmola is currently completing his post graduate studies on industrial management. Working name of thesis is ”Total Productivity and Its Relationship to Throughput Accounting”, and it is focused on the electronics contract manufacturing environment using case-study research approach (for more information see http://www.uwasa.fi/~d73786). Correspondences: Department of Information Technology and Production Economics, University of Vaasa, P.O. Box 700, FIN-65101 Vaasa, Finland or by e-mail olli-pekka.hilmola@uwasa.fi. |